
Plastic Dynamics from Land to Ocean
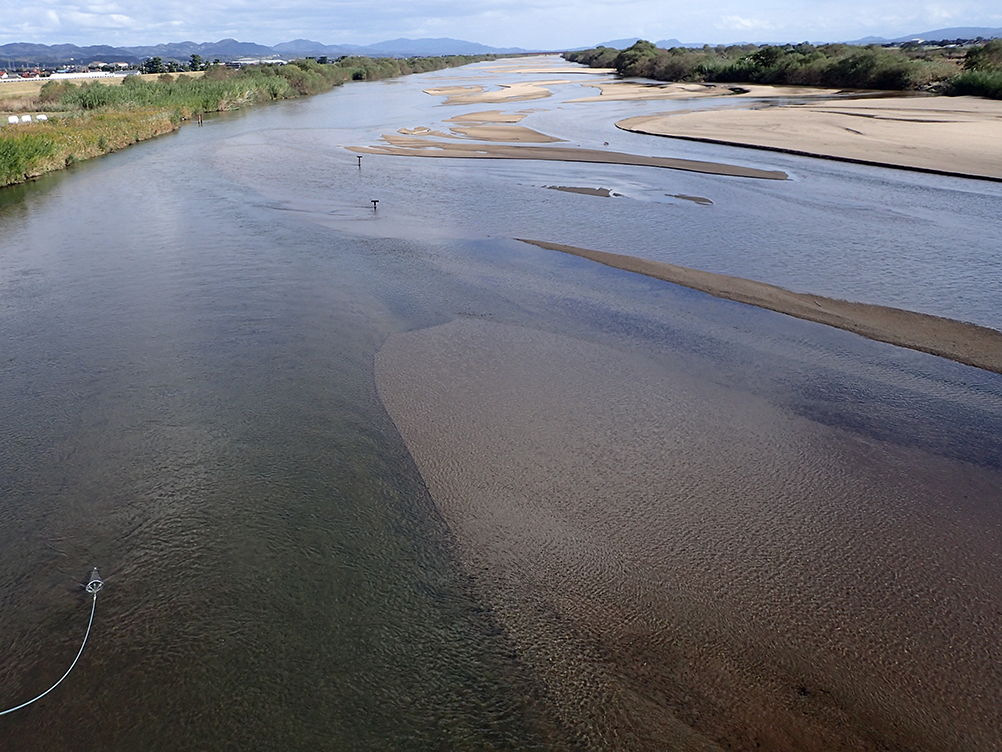
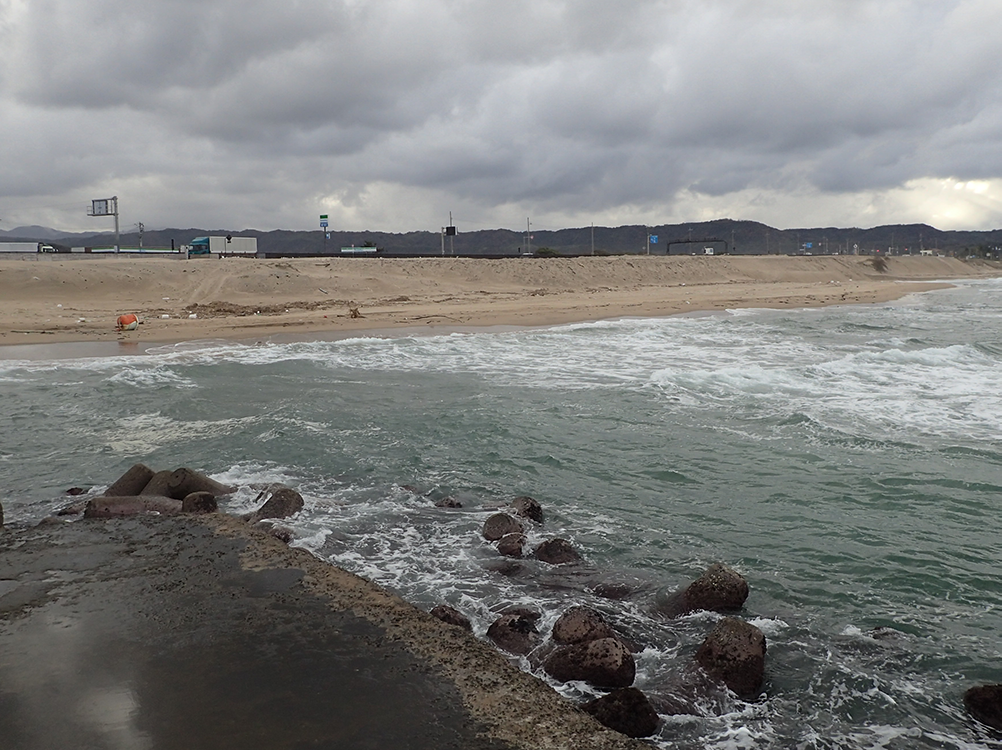
Have you ever lived without using plastic? Probably no one has — plastic is everywhere in our daily lives. Recent scientific and citizen surveys have found that plastics, so essential to daily life, end up in rivers, lakes and oceans, posing a potential threat to marine life. Our laboratory studies both fine "microplastics" (MicP, under 5 mm) and the "macroplastics" (MacP) that generate them, aiming to clarify how plastics flow from our living areas to the coastal ocean and to propose solutions and mitigation measures for marine plastic pollution.
Microplastics
Microplastics: Featured Papers
Microplastics: Featured Papers
Monitoring of microplastics in aquatic environment
The numerical and mass concentrations of microplastics collected at 36 sites on the surfaces of 29 Japanese rivers were mapped and compared with four basin characteristics (basin area, population density, and urban and agricultural ratios) and six water quality parameters (pH, biochemical oxygen demand (BOD), suspended solids (SS), dissolved oxygen (DO), total nitrogen (T-N), and total phosphorus (T-P)) in each river basin. Microplastics were found in 31 of the 36 sites, indicating that some plastics fragment into small pieces before reaching the ocean. The microplastic concentrations are significantly correlated with urbanisation and population density, indicating that the microplastic concentrations in the river depend on human activities in the river basin.
Kataoka et al., 2019. Assessment of the sources and inflow processes of microplastics in the river environments of Japan. Environ. Pollut. 244, 958-965. 10.1016/j.envpol.2018.10.111 | Read PDF
Experimental uncertainty assessment of river microplastic sampling
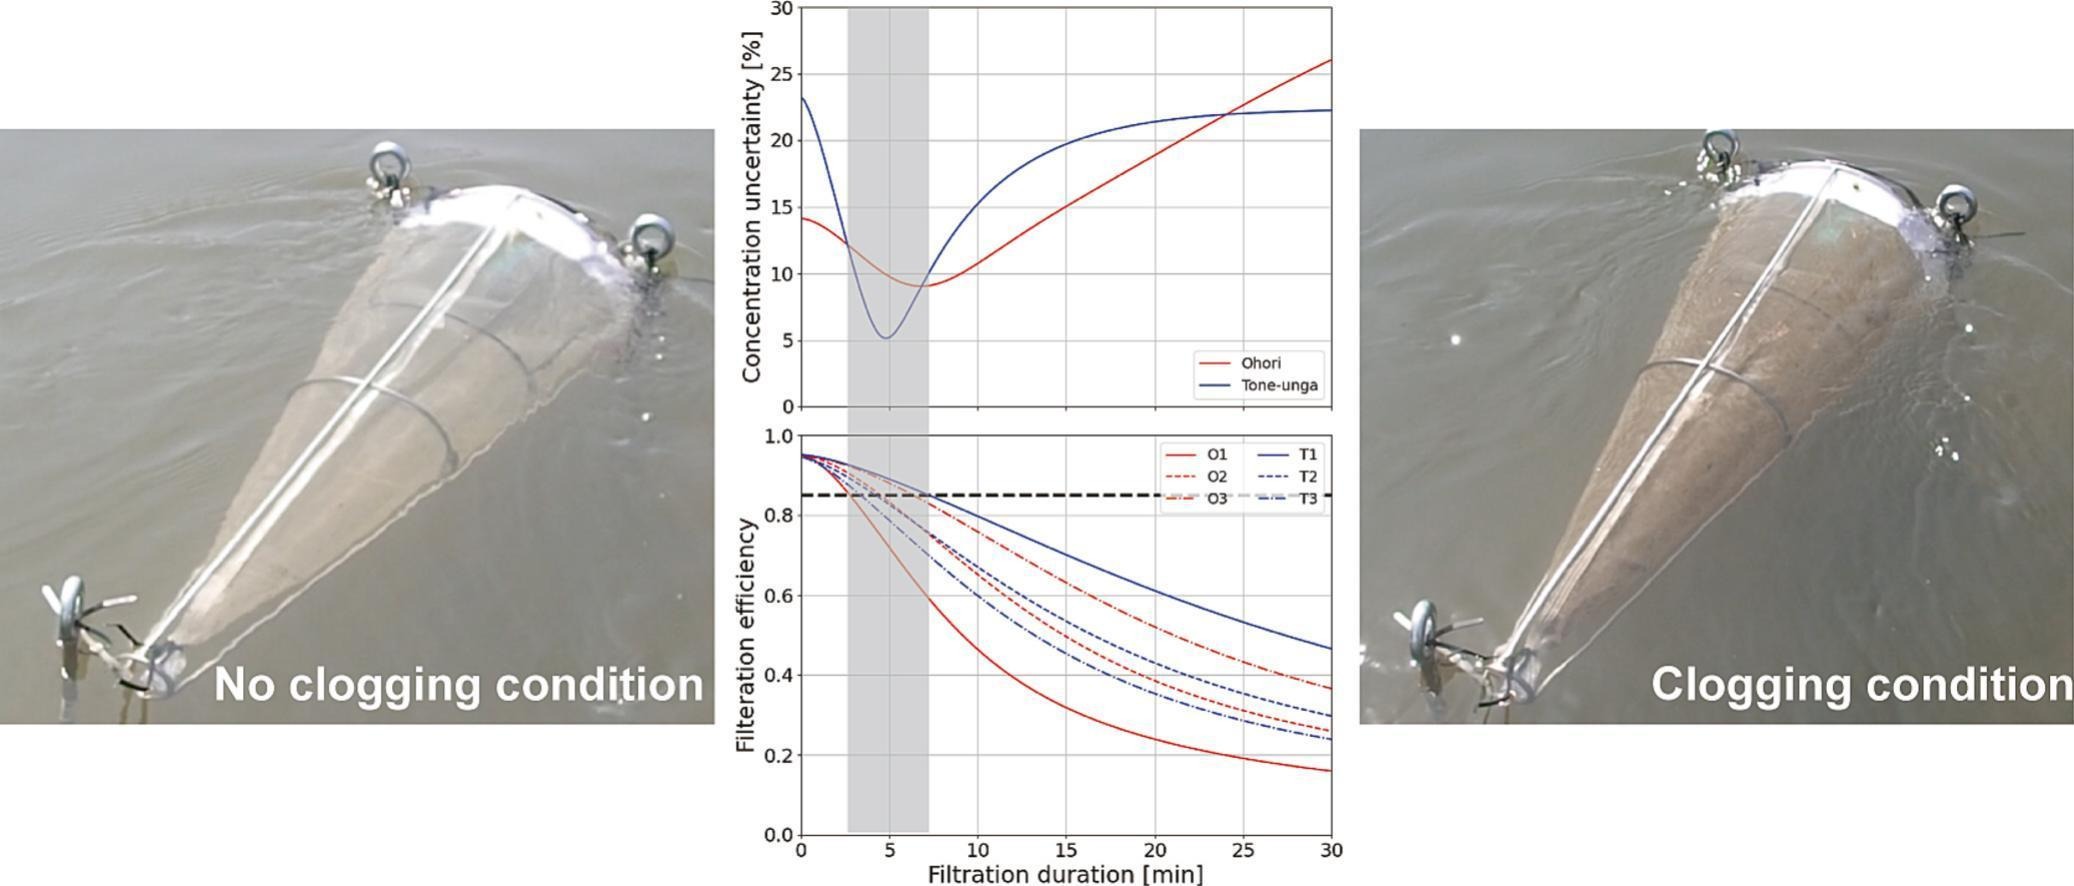
Net sampling of meso- and microplastics (MMP) is known to suffer from a loss of capture efficiency over time as the net becomes clogged, introducing uncertainty into the resulting concentration estimates. We experimentally examined this uncertainty at two urban rivers with different contamination levels (the Ohori and Tone-unga Rivers), conducting 32 net samplings across five filtration durations within a single day. The variance in measured concentration consistently increased with longer filtration duration, and this behaviour could be described using the Weibull reliability function (WRF). A WRF-based model further allowed us to predict, without prior knowledge of the contamination level, the optimal filtration duration that sustains at least 85% filtration efficiency (2.6–6.2 min for the Ohori River and 3.2–7.1 min for the Tone-unga River). These findings contribute to standardizing net-sampling methodology for MMP monitoring.
Kataoka, T., Tanaka, M., Mukotaka, A., Nihei, Y., 2023. Experimental uncertainty assessment of meso- and microplastic concentrations in rivers based on net sampling. Sci. Total Environ. 870, 161942. 10.1016/j.scitotenv.2023.161942 | Read PDF
Geometric relationship between particle size and mass
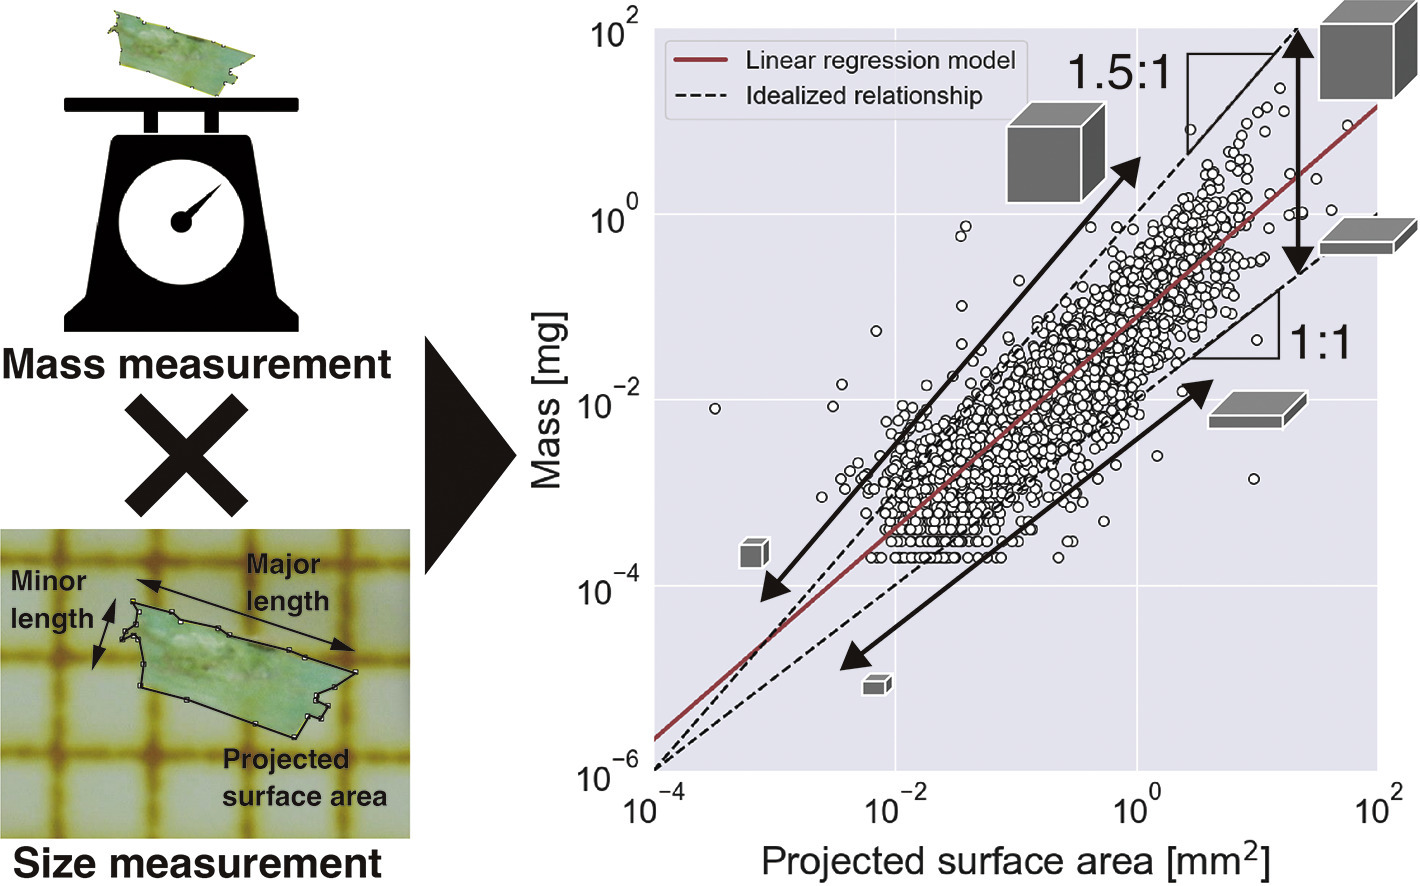
Accurately quantifying the mass concentration of meso- and microplastics (MMP) is essential for assessing the global inventory of ocean plastics and evaluating environmental and health risks. We directly measured the mass of 4,390 MMP particles collected at 35 sites across 17 Japanese rivers using an ultramicrobalance, and formulated a log-linear regression model relating mass to the projected surface area obtained from image analysis. This approach estimates mass more accurately than previous methods that assume simple three-dimensional shapes such as cuboids. We also found that the slope of the regression depends on the particle's three-dimensional shape, while the intercept depends on its third dimension (thickness). These results make it possible to accurately estimate MMP mass concentrations in aquatic environments using area information from image analysis alone.
Kataoka, T., Iga, Y., Baihaqi, R.A., Hadiyanto, H., Nihei, Y., 2024. Geometric relationship between the projected surface area and mass of a plastic particle. Water Res. 261, 122061. 10.1016/j.watres.2024.122061 | Read PDF
Macroplastics
Macroplastics: Featured Papers
Macroplastics: Featured Papers
A technique for quantifying macro-plastics flowing on water surface
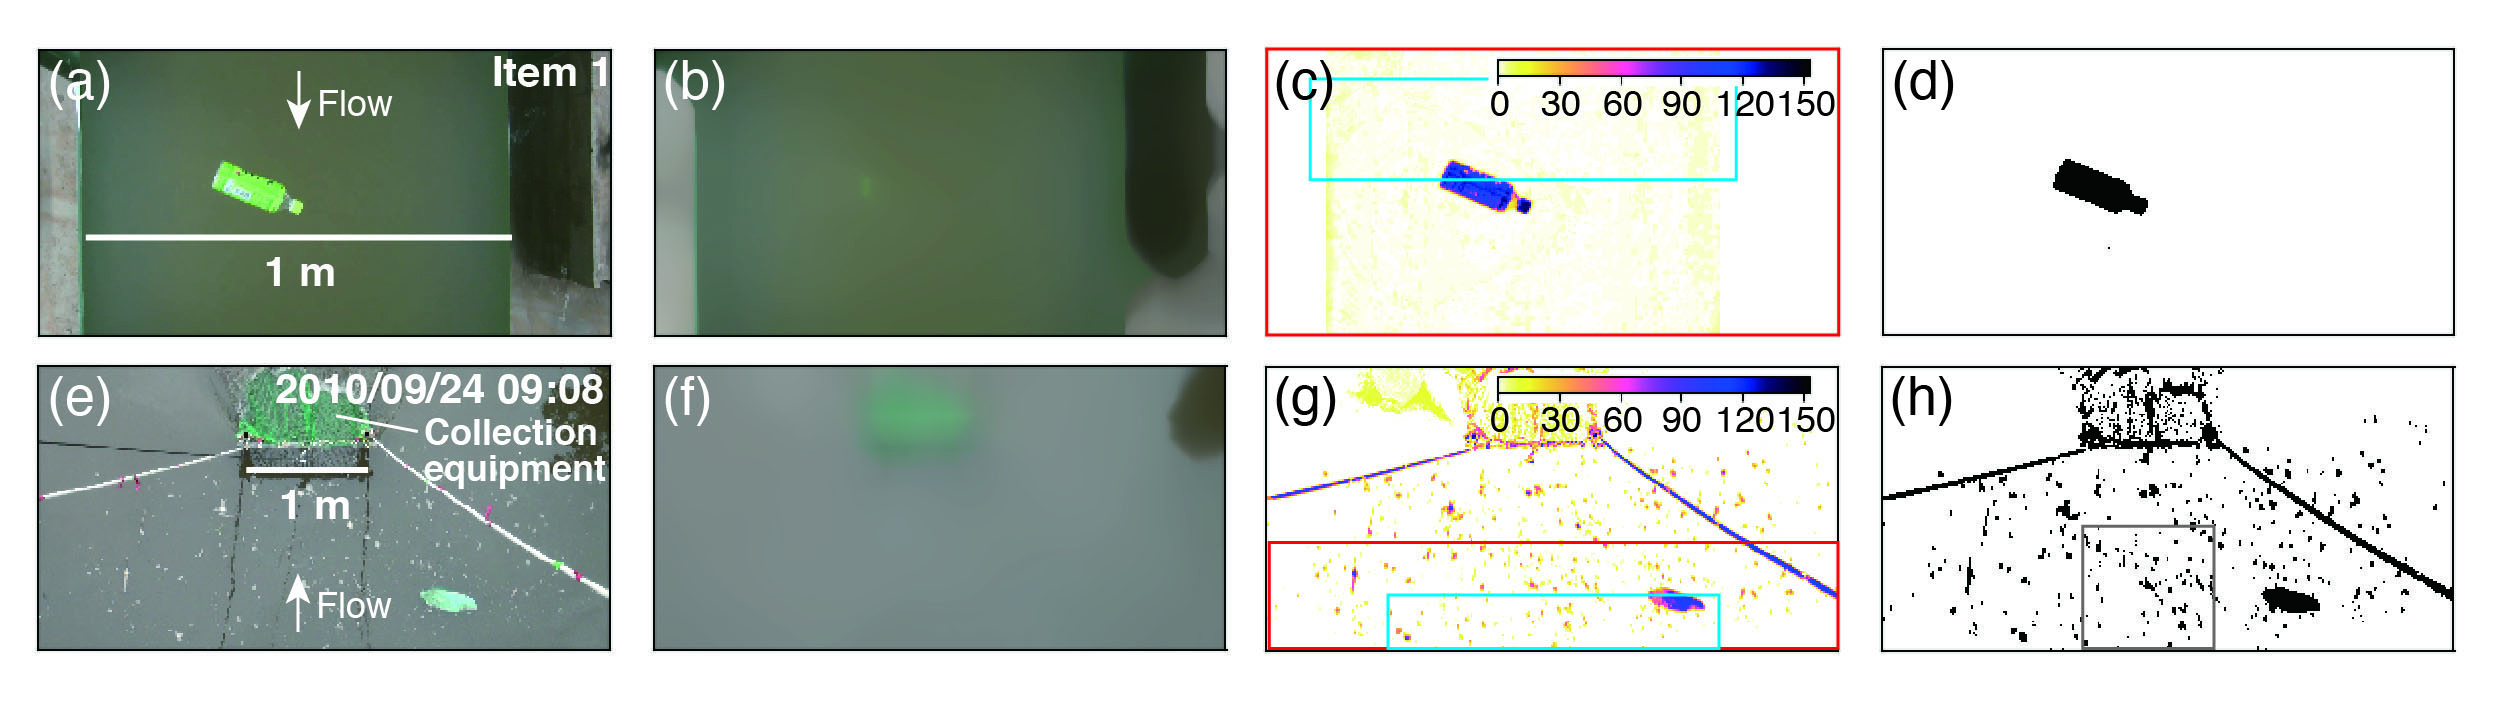
A new algorithm has been developed to quantify floating macro-debris transport on river surfaces that consists of three fundamental techniques: (1) generating a difference image of the colour difference between the debris and surrounding water in the CIELuv colour space, (2) detecting the debris pixels from the difference image, and (3) calculating the debris area flux via the template matching method. Debris pixels were accurately detected from the images taken of the laboratory channel and river water surfaces and were consistent with those detected by visual observation.
Kataoka and Nihei, 2020. Quantification of floating riverine macro-debris transport using an image processing approach. Sci. Rep. 10, 2198. 10.1038/s41598-020-59201-1
Instance segmentation models for detecting floating macroplastic debris
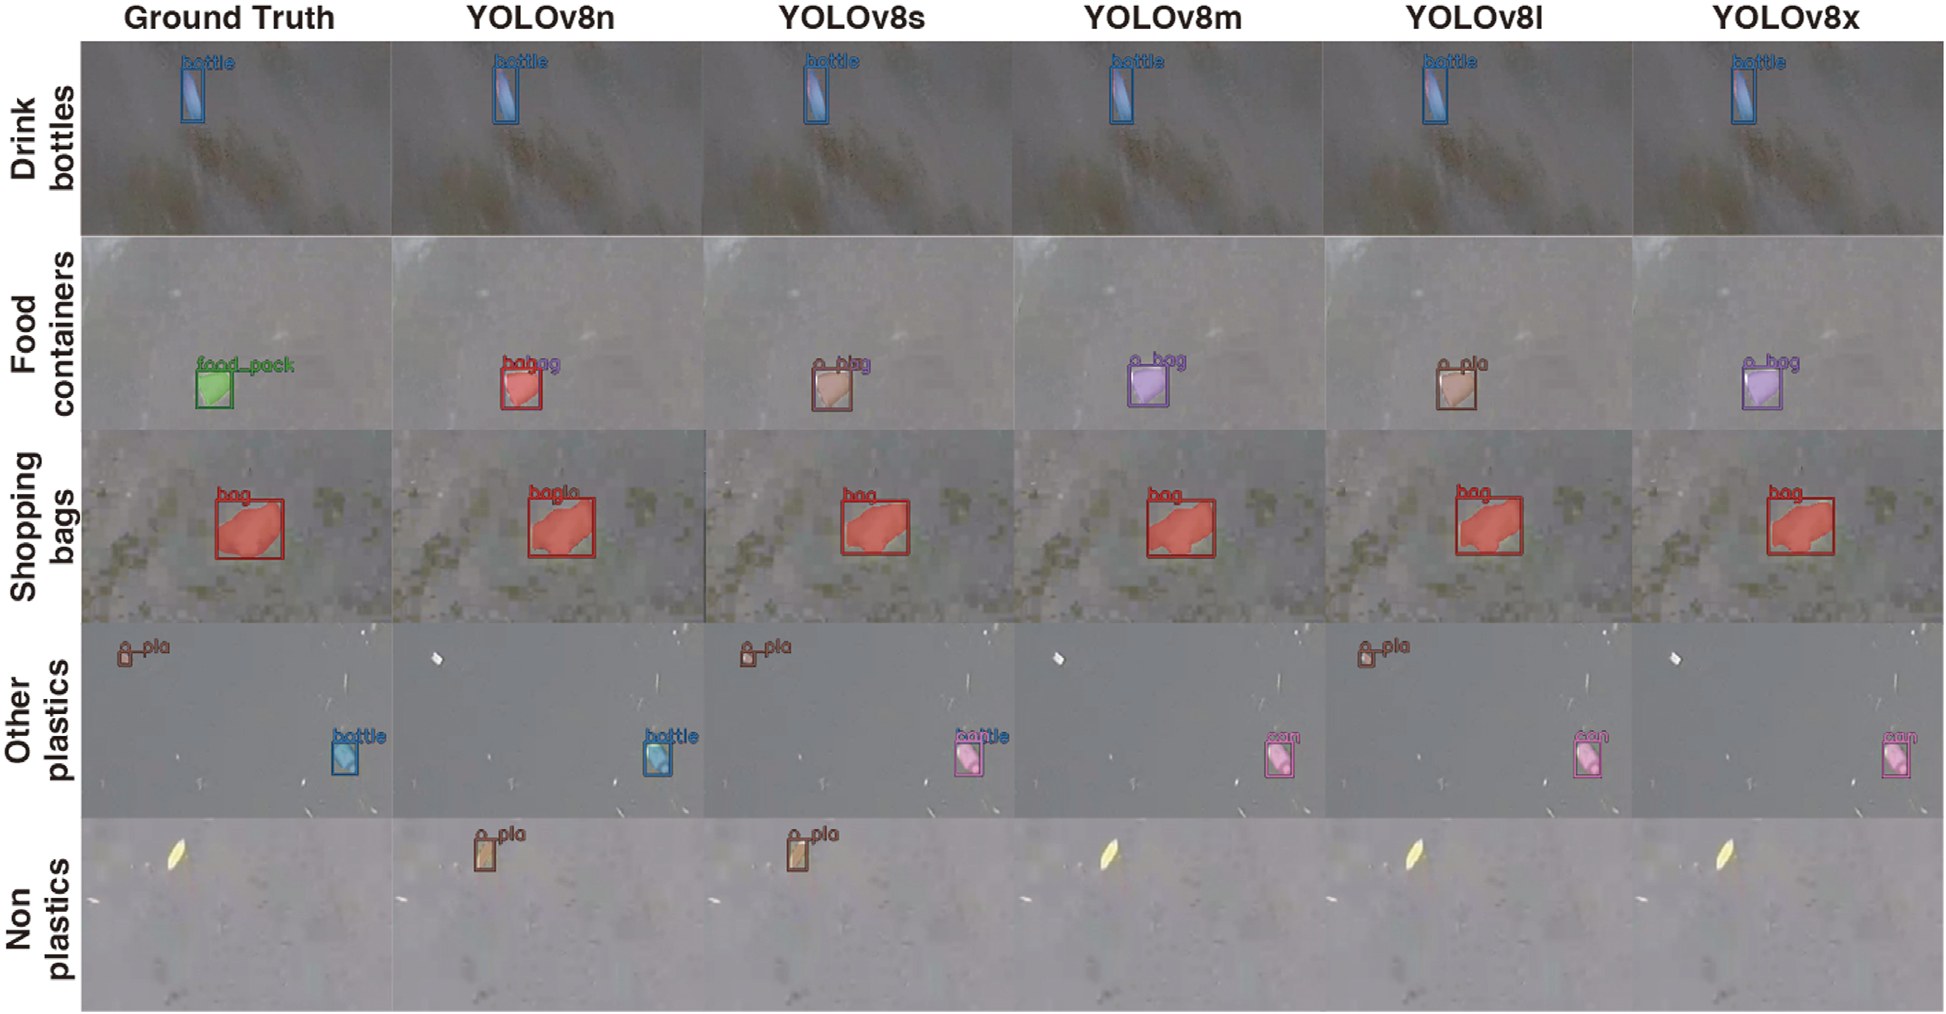
Quantifying the transport of floating macroplastic debris (FMPD) requires a robust detection technique. Using 7,356 training images collected via fixed-camera monitoring of seven rivers, we developed five instance segmentation models based on the YOLOv8 architecture. These models detected FMPD with accuracies similar to the pretrained YOLOv8 model. Testing on 3,802 images from a novel camera system embedded in an ultrasonic water level gauge (WLGCAM) installed in three rivers showed that a model with an intermediate number of parameters performed best, while the largest model suffered from overfitting (Fig.5). We also found that the optimal ground sampling distance (GSD) differs between object-detection and image-segmentation approaches.
Kataoka, T., Yoshida, T., Yamamoto, N., 2024. Instance segmentation models for detecting floating macroplastic debris from river surface images. Front. Earth Sci. 12. 10.3389/feart.2024.1427132 | Read PDF
RiSID: an open river surface image dataset
Developing AI models to detect floating macroplastic debris from images requires large training datasets. We built and released RiSID, comprising 7,356 images recorded at 11 sites on seven Japanese rivers under high-flow conditions, together with pixel-wise segmentation annotations. The annotations are organised into three datasets with 7, 5 and 2 debris categories respectively, provided as JSON files in the MS COCO format. RiSID is intended as a useful benchmark for researchers developing models for floating macroplastic monitoring.
Kataoka, T., Yoshida, T., Yamamoto, N., 2025. RiSID: River Surface Image Dataset for Instance Segmentation of Floating Macroplastic Debris. Data Brief 112189. 10.1016/j.dib.2025.112189 | Read PDF
RiSIM: an AI-based river surface monitoring system for floating plastic transport
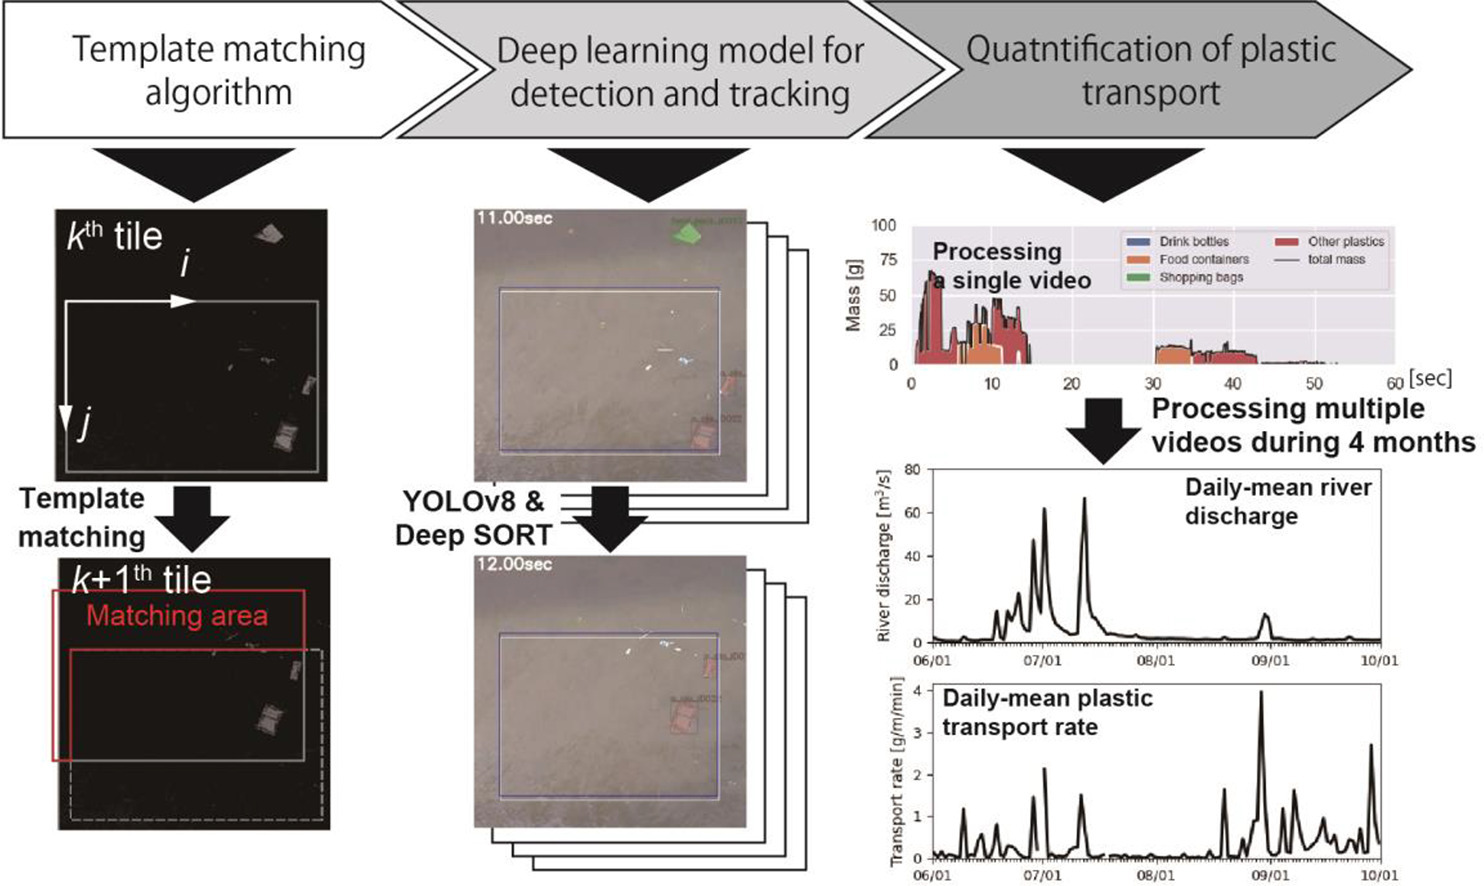
Continuous monitoring of plastic transport in rivers is essential for developing countermeasures against marine plastic pollution. We developed a river surface image monitoring software, RiSIM, that integrates three techniques: (1) a template matching algorithm that finds corresponding areas between frames, (2) deep learning models (YOLOv8 and Deep SORT) for plastic detection, classification and tracking, and (3) calculation of transport rate in terms of both quantity and mass. Validation through a mark-release-recapture experiment and in-situ visual observation showed that RiSIM-derived transport rates closely matched ground truth data (r = 0.91 for quantity, r = 0.80 for mass), including during flood events. A four-month continuous observation also revealed a significant relationship between daily-mean plastic transport rate and river discharge. This is a joint study with Yachiyo Engineering Co., Ltd. and Wageningen University, also featured in an Ehime University press release (press release).
Kataoka, T., Yoshida, T., Sasaki, K., Kosuge, Y., Suzuki, Y., van Emmerik, T.H.M., 2026. RiSIM: River surface image monitoring software for quantifying floating macroplastic transport. Water Res. 288, 124678. 10.1016/j.watres.2025.124678 | Read PDF
PRIMOS: social implementation of an AI-based riverine litter monitoring system
Building on the research above (the instance segmentation models, RiSID, and RiSIM), Yachiyo Engineering Co., Ltd. and Ehime University jointly developed PRIMOS (Plastic Runoff Identification, Monitoring & Observation System), a system that automatically detects and classifies plastic litter on river surfaces, and began offering it as a commercial service on April 14, 2025. PRIMOS is provided as a web service: users simply upload video footage of a river, and an image-analysis AI (a YOLOv8-based instance segmentation model) automatically quantifies the type and amount of litter. Compared with our earlier colour-difference-based transport measurement software "RIAD" (developed in 2021), PRIMOS makes it possible to distinguish litter types and to detect litter reliably even under fluctuating water levels during floods, and is expected to be used by construction consultants, environmental survey firms, local governments, and research institutions.
Joint development: Yachiyo Engineering Co., Ltd. × Ehime University (service launched April 14, 2025) | Press release | Official PRIMOS website
Remote Sensing Technology for Monitoring Ocean Waves
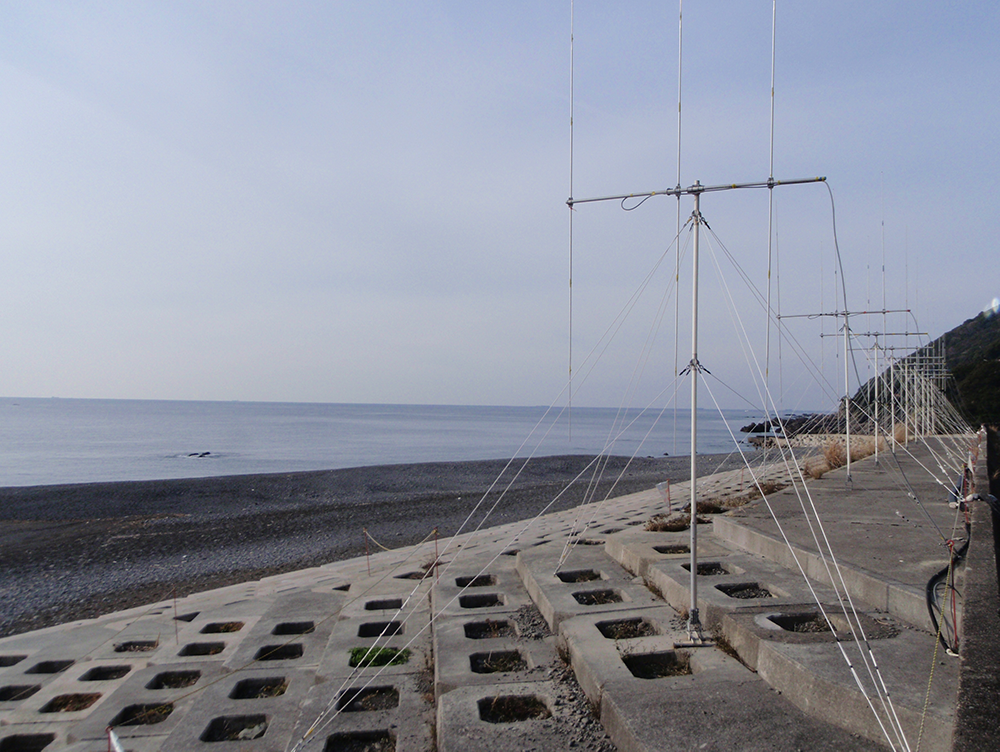
This research aims to develop a technique for measuring ocean waves with high spatiotemporal resolution using high-frequency radars and to clarify a spatiotemporal fluctuation of ocean waves in coastal region. High-frequency radar transmits radio waves toward the sea surface from land and receives the scattered signal, allowing wave and current conditions to be measured over a wide area rather than at a single point.
Ocean Wave Monitoring
Featured Paper
Featured Paper
Validation of significant wave height measured by high-frequency (HF) radar systems in an estuary region
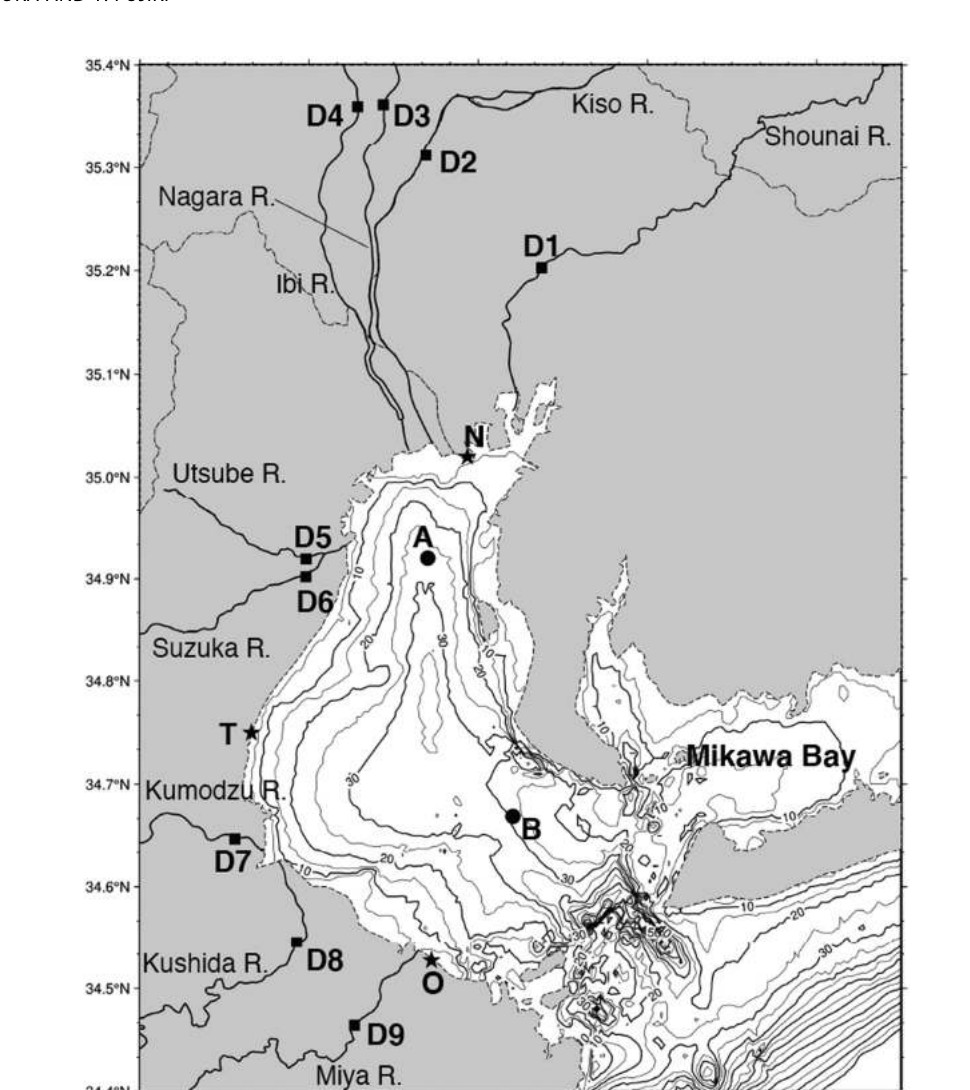
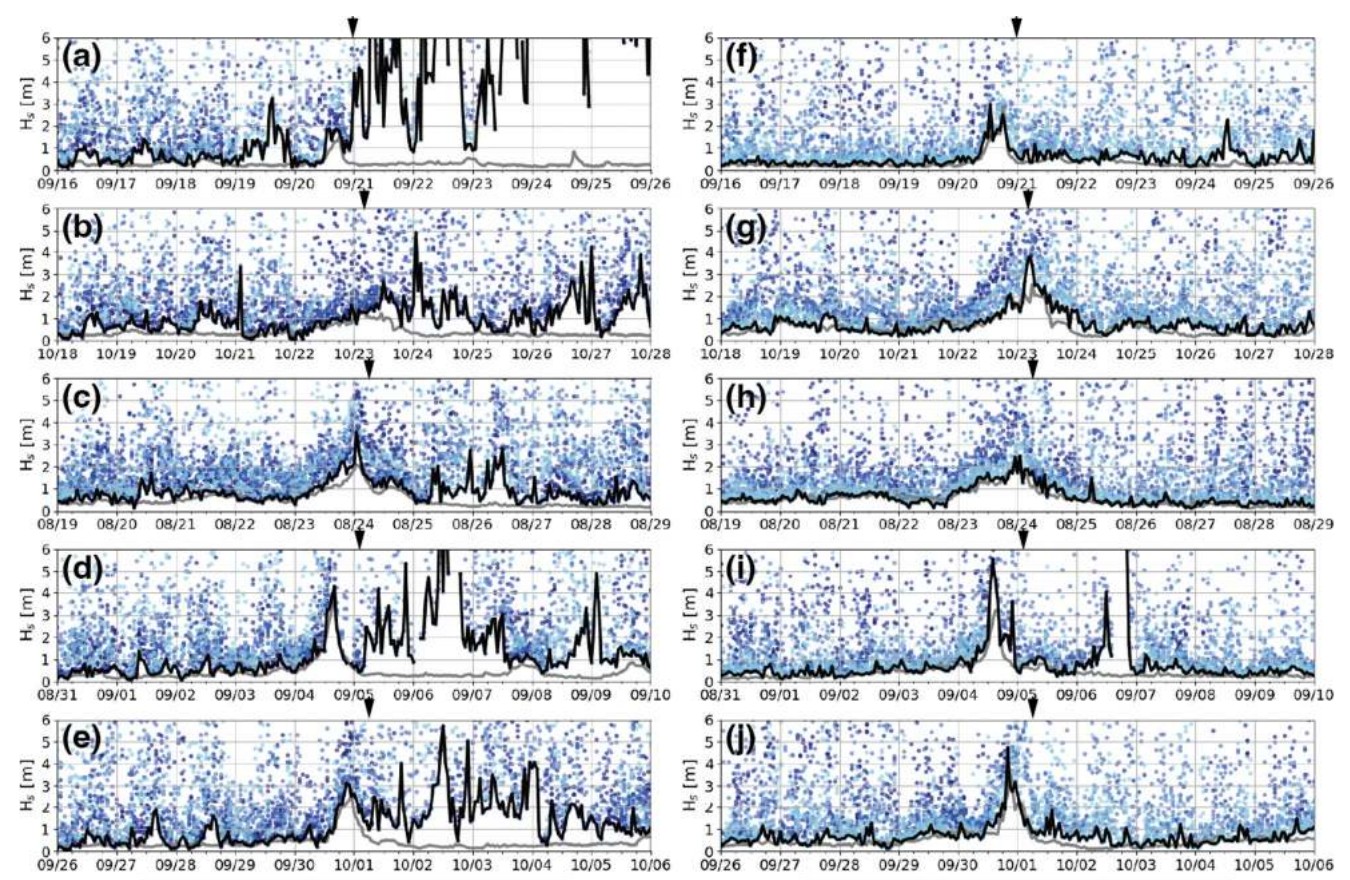
High-frequency radar can, in principle, seamlessly capture waves as they propagate from the open ocean into the coast. Near the coast, however, freshwater inflow in estuarine (brackish) waters lowers the electrical conductivity of the surface water, which is expected to degrade HF radar wave measurements. We tested this using three HF radar stations (N, T and O; Fig.3) deployed in Ise Bay, one of Japan's largest estuarine embayments, focusing on five periods (p1–p5) between 2016 and 2018 when typhoons and other events produced pronounced wave growth. We compared the significant wave heights (Hs) derived from the radars against in-situ wave-gauge/buoy observations at two stations, A (near the river mouth) and B (further offshore) (Fig.4). At Stn. A, radar-derived Hs showed markedly larger errors during p1 — the period with the largest river discharge — consistent with reduced conductivity from freshwater inflow. At the more offshore Stn. B, this degradation was much smaller, showing that the applicability of HF radar in estuarine waters depends strongly on the extent of freshwater influence. Building on these findings, we are also investigating signal-to-noise ratio (SNR) criteria to further improve measurement accuracy.
Kataoka, T., Fujiki, T., 2024. Applicability of ocean wave measurements based on high-frequency radar systems in an estuary region. Coastal Engineering Journal 66, 58-73. 10.1080/21664250.2023.2275469 | Read PDF